Mar. 10, 2025
Workout data in 3D
Exploring web-based 3D graphics for fitness data
While running my rounds around the village, it struck me that I could use ThreeJS to craft a dynamic 3D representation of my workout data. Read along to see what I’ve created—it’s a work in progress but serves as an exciting exploration of the concept.
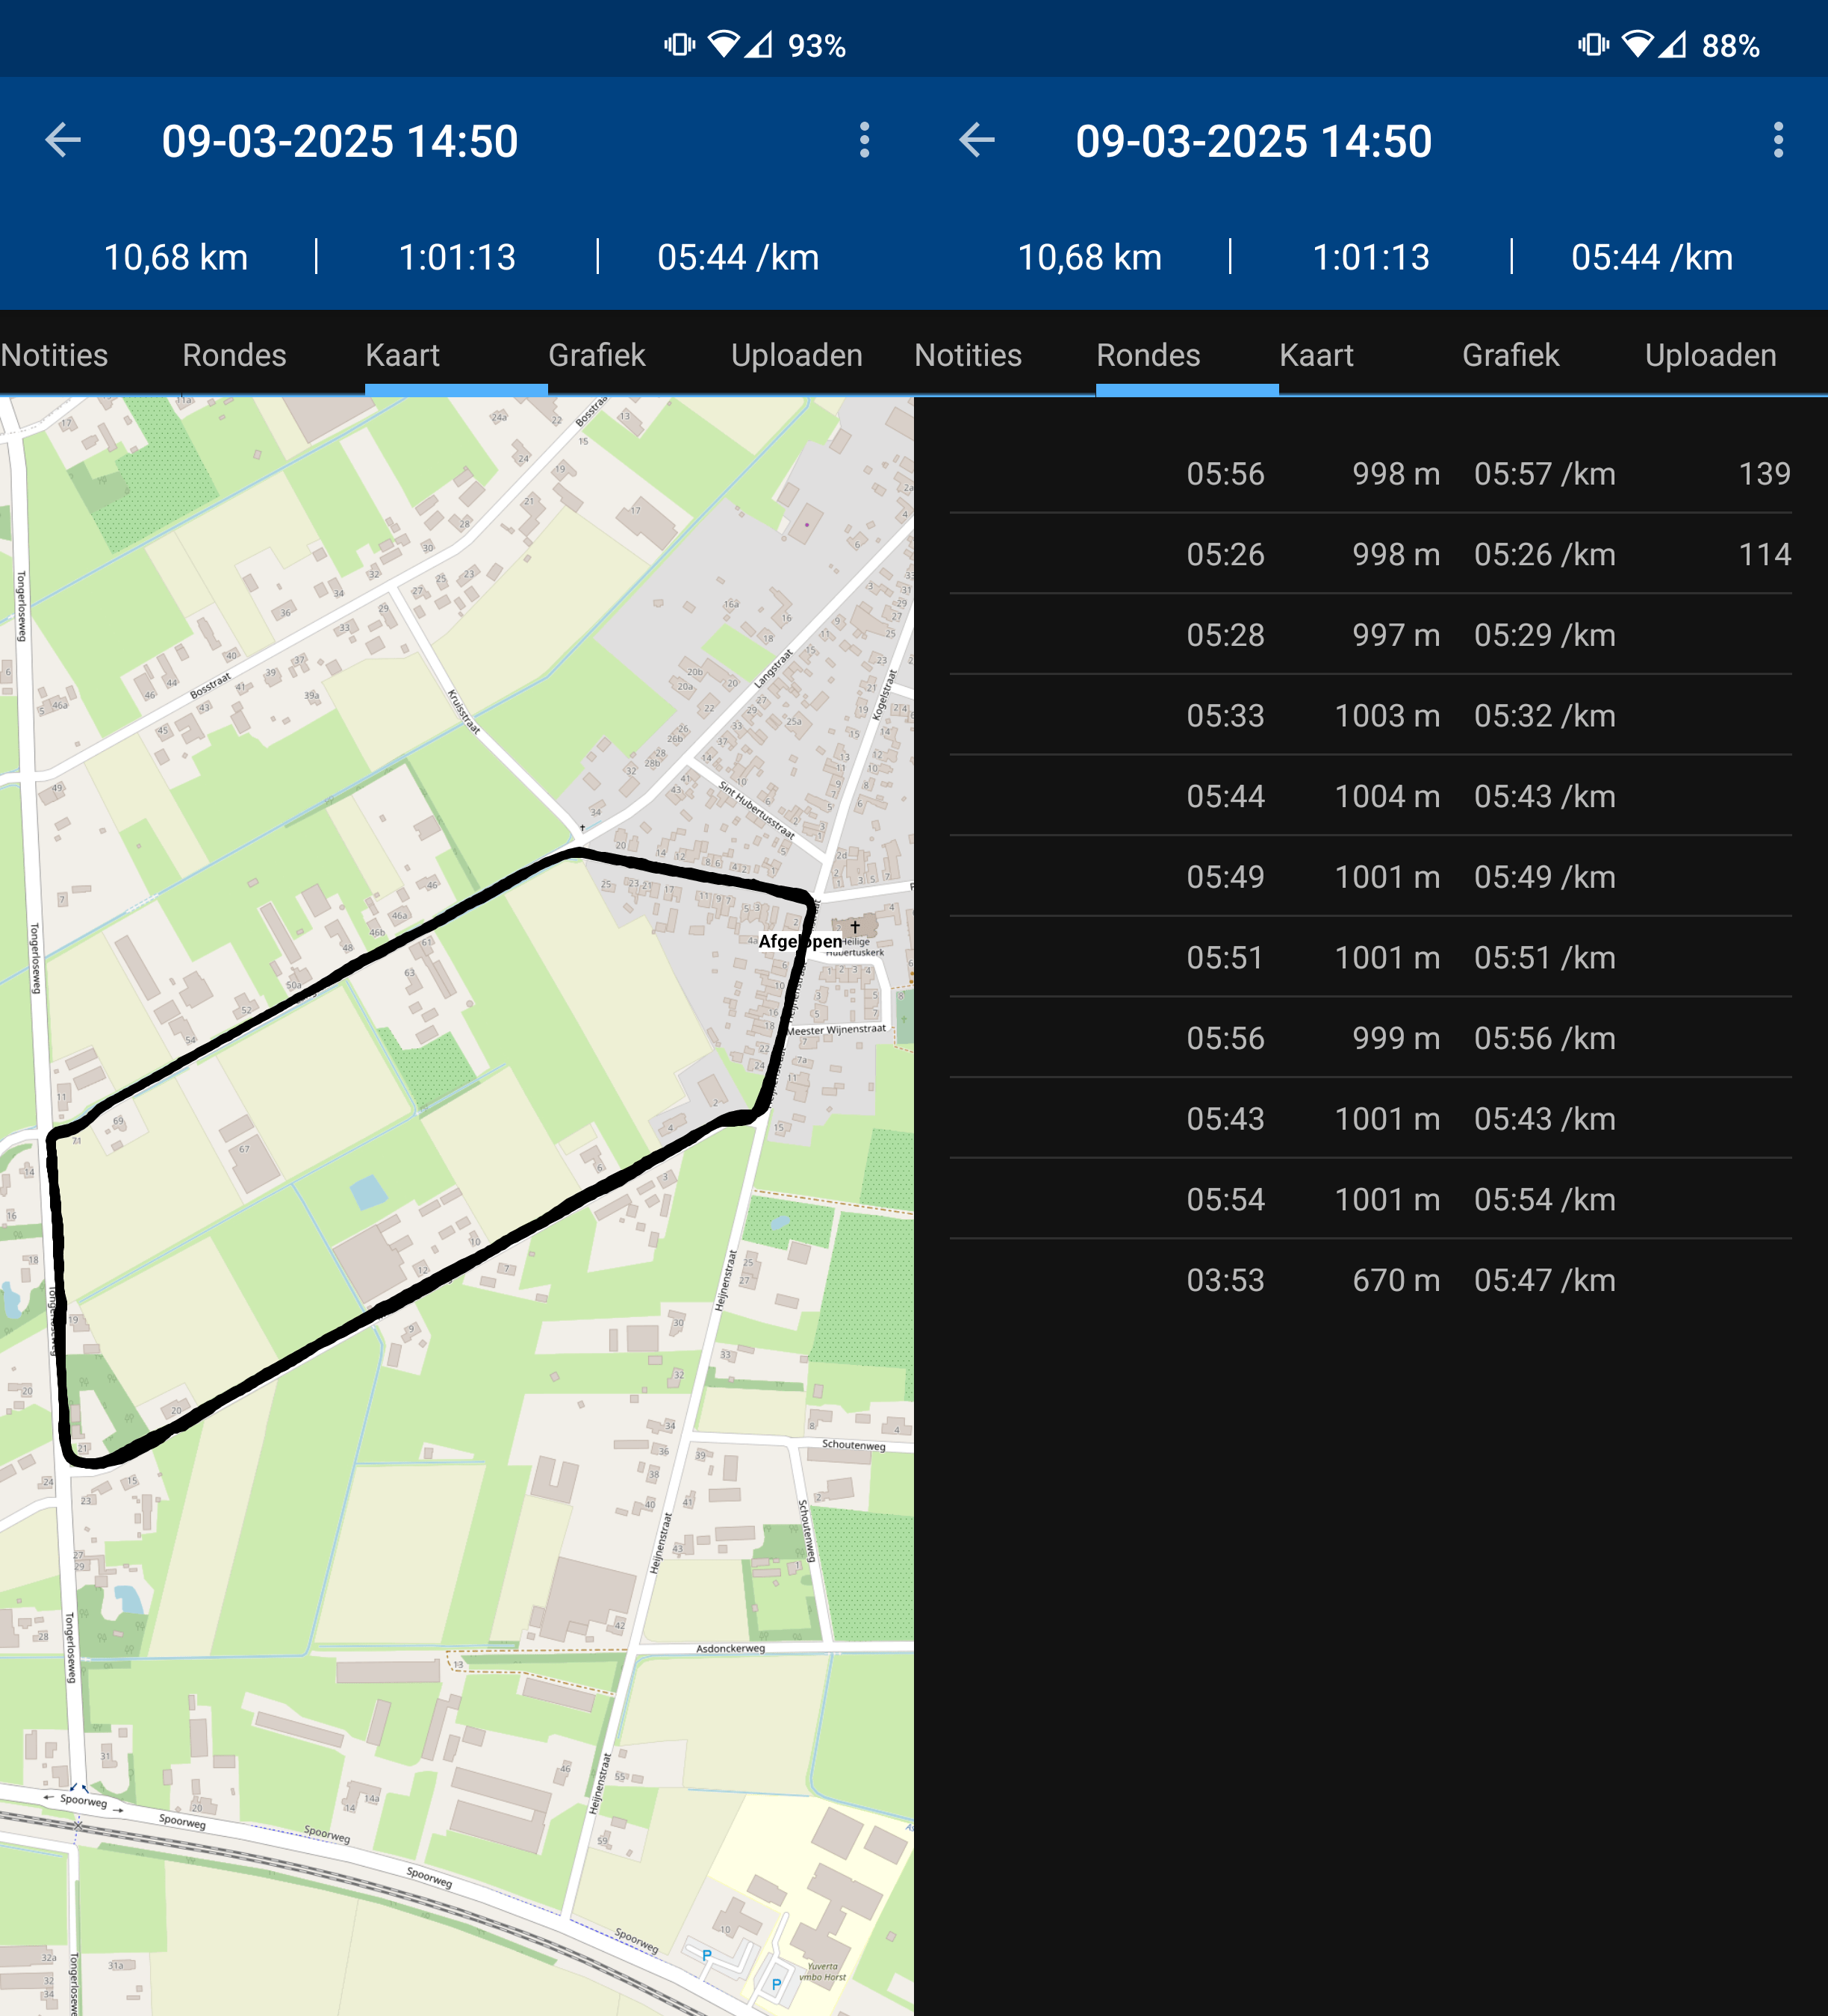
I’m exploring ways to visualise workout data, leveraging web technologies for compatibility across devices for Gran Fondo, my running and cycling app. ThreeJS, a 3D rendering tool for browsers, works seamlessly on large and small screens alike. I’m using the TCX workout data format because it’s suitable for parsing with standard browser and web technology. For this project, I tapped into a recorded session from my run on March 9—my standard 1.8KM loop around the village, repeated 6 identical times (totalling 11KM). I like this route; it’s low on traffic and disturbances, letting me focus on the run. I collected the TCX data using the RunnerUp app; it gets the job done but looks a bit dated and lacks interactive analysis and exploration of workout data.
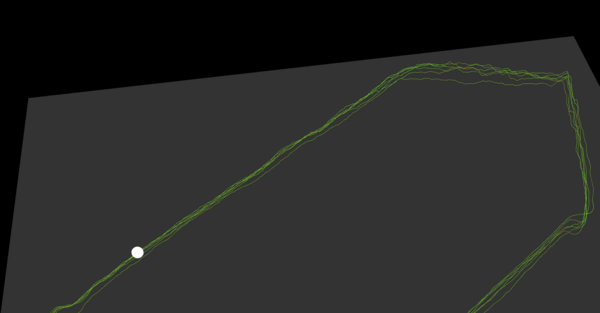
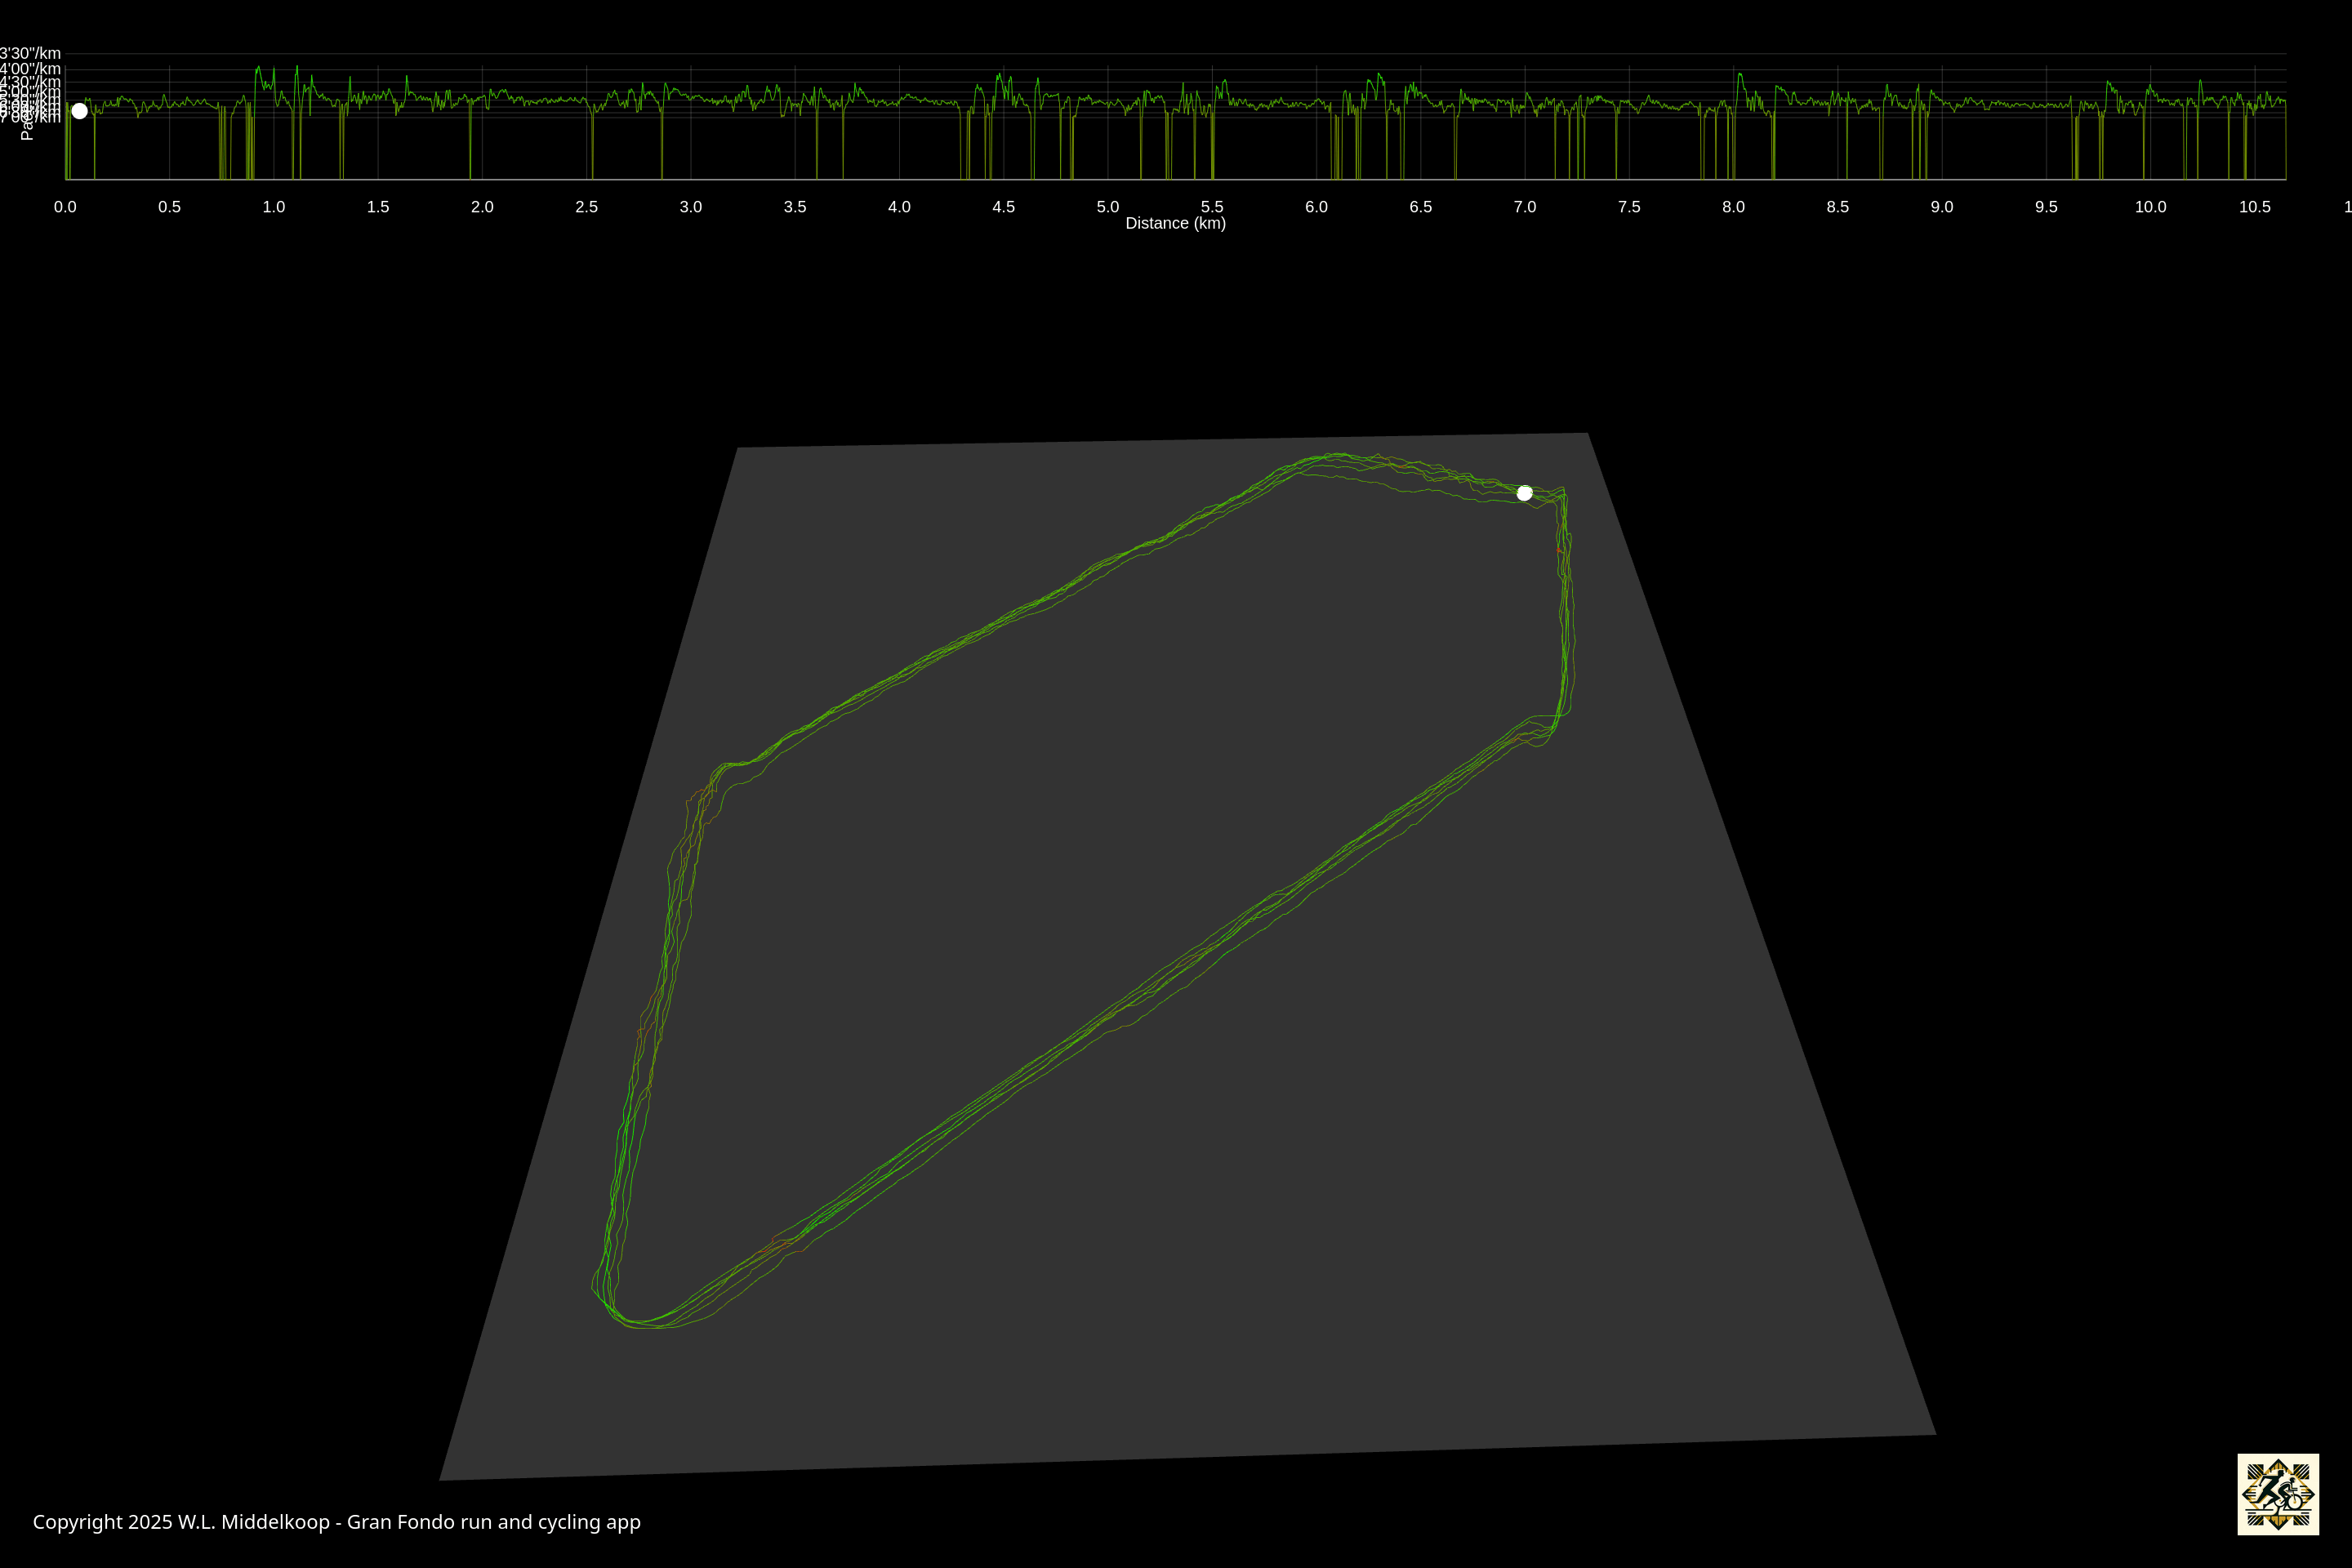
As a proof of concept to explore 3D presentation, I built a prototype that loads the TCX file containing the workout data. The browser parses this data and generates two visualisations: a 3D render using ThreeJS and a 2D linear graph showing pace. Colour represents speed—greener lines indicate a faster pace. The 3D visualisation rotates like a vinyl record, revealing my six laps around the village, with its shape matching the map. To link both graphs, I added a white circle that marks the same point in time on each, helping to illustrate the connection between the two views.
The visualisation is built 100% with web technologies, using ThreeJS to render the 3D run path. A second HTML5 canvas overlays a 2D pace graph, while a centralised animation loop ties both scenes together with a traversing dot, syncing the route and graph. This is part of a “thinking out loud” experimentation phase, where I’m exploring innovative ways to visualise fitness data. It’s a demo for my upcoming Gran Fondo app, aiming to enhance interactive fitness tracking with rich, engaging visualisations.
Check out the visualisation on your own computer by opening this page: demo time Please note that this is not a polished demo, it is "fresh from the bench" and works mainly well on landscape window orientations. Future versions will have a lot more polish to make all the elements fit in a responsive design.
The Gran Fondo app will include heart rate, cadence, and power for deeper insights. Interactivity will allow touch-based rotation of the 3D graph and zooming into details. My goal is to make workout analysis more immersive, intuitive, and engaging for athletes seeking a comprehensive view of their performance.
Conclusion
Experimentation is a crucial part of software design—it allows you to test ideas, refine concepts, and gather feedback from others. This 3D workout visualisation is an example. There’s much more to explore. Stay tuned to this blog for future updates as I continue developing Gran Fondo!

Download
If you enjoy reading offline, this article is available for download:
Translations
This article is available in the following languages:
RSS / Atom
Grab one of the feeds to stay up to date, the feeds contain the full posts: