Aug. 11, 2025
Willemstagram
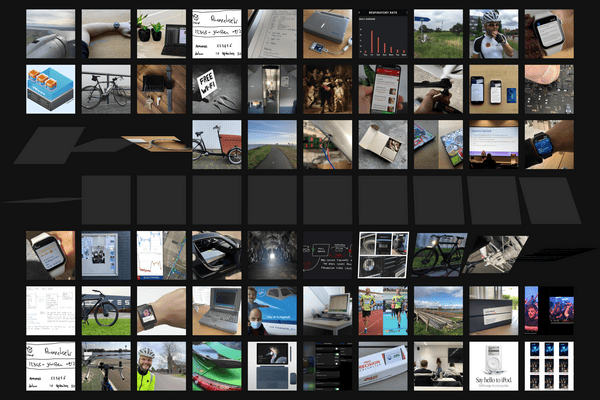
3D flip-flap photo display showing stories
Last week I sat with a customer looking at the new willem.com homepage where I use a narrative to tell about the things I do. This customer is one of the best visionary create thinkers, yet my text didn't seem to speak to him. Thinking about this, I remembered an important psychology lesson from the University: I needed something different, something non-linear, this post is about delivering a visual punch!
Left versus Right Brain Thinking
One of the cool things of my education at the University of Amsterdam was that we got classes from different faculties, forming an interesting mix of interdisciplinary science. One classic book we discussed was "Mintzberg on Management" in which the author elaborates why different people prefer different things, the classic dichotomy often simplified as left versus right brain thinkers:
- The linear thinker (the left brain): This is the natural state for people that appreciate a logical narrative that builds from A to B to C. Typical persons like this are storytellers, architects and programmers.
- The non-linear thinker (the right brain): This is the state of people that don't follow a straight line. They scan for impressions, vibes and emotional takeaways. Typical persons like this are create folks including artists and visionary thinkers.
My new willem.com homepage worked well for linear thinkers like me, the text based narrative suits the left-brain. But, my design lacked for people who go best on non-linear, vibefull impressions. I needed something that exposes the many visuals in a rich and dynamic way, alive and with a healthy dose of interactive fun.
Solari Board
Many moons ago I met my wife on Utrecht Centraal Station, right under the gigantic departure information board. The iconic 7x4.20M blue info board, weighing around 3000 kilos, featured flip-flapping mechanical panels producing a recognisable sound you would hear every minute or so in the central hall of the station. This type of signage display is often called a "Solari Board", named after Solari di Udine, the Italian company that produced these icons. These days the Utrecht station features digital info displays, but if you want you can still see it in Het Spoorwegmuseum.

As a metaphor aficionado (book tip: Metaphors we live by), I figured the Solari Board, with its "flip-flapping" would be a lovely way to allow visitors of willem.com to "depart" to various "destinations" (the stories) on the site. Instead of using text, I deliberately chose to use the photos and visuals inside the blog posts as gateways into the insights-section on willem.com. By randomly revealing new destinations this is perfectly non-linear and by making it interactive (clickable and touchable) it is more engaging than plain text. Every destination opens a "ticket" explaining a little bit of what it is you're looking at. If you like what you see, you can hit the big button to open the story right at the position of the image, which could be halfway a blog post. Stories open in new browser windows, enabling you to return to the "station" to find a new destination.

Implementation: ThreeJS and custom image API
Earlier I experimented with the ThreeJS 3D graphics engine to visualise workout data. It is a library using the HTML5 standard canvas element to output graphics generated utilising spatial computing, a fancy way to say it enables you to draw things on three dimensions (x, y, z) instead of two, hence its name. It provides camera, light and fog controls and it is designed to enable animations based on simulated position and rotation. It is pretty cool to play with and quite capable. See these earlier two posts on my experiments with ThreeJS:
The minimalist in me briefly considered going with CSS animations, transforms and transitions. But I figured the realistic perspective, where the outermost panels rotate more skewed, and the randomness in selecting new visuals would require me to use JavaScript anyway. To maximise its value I wanted to integrate it right on my homepage. But, loading a complete 3D engine is not something to consider lightly. To minimise its effects on the homepage's loading time, I carefully designed the thing to be loaded asynchronously and entirely optional (for people with JS disabled).

To feed the "Visual Journal", I designed a custom API that serves highly optimised images scaled to 400x400px. Each image has a localised title and a deeplink with an hashtag (slug) anchor, enabling the deep diving into stories. I rely on my own lemmid platform to provide me with the required infrastructure to pull this off. In the background an optimised NodeJS service generates the images using imagemagick, jpegoptim and pngquant. You can check out the API yourself on https://willem.com/en/images.json outputting a JSON array like:
[
  {
    "url": "/en/2020-07-30_upgrading-a-27-inch-imac-5k-to-14-terabytes/i_15_An-average-fly-is-bigger-than-most-screws-inside-the-iMac_400x400px.jpg",
    "title": "An average fly is bigger than most screws inside the iMac",
    "target": "/en/2020-07-30_upgrading-a-27-inch-imac-5k-to-14-terabytes/#an-average-fly-is-bigger-than-most-screws-inside-the-imac"
  },
  {
    "url": "/en/2019-06-25_assembling-a-cargo-bike/i_11_Using-filler-plates-to-make-up-for-Chinese-Precision_400x400px.jpg",
    "title": "Using filler plates to make up for Chinese Precision",
    "target": "/en/2019-06-25_assembling-a-cargo-bike/#using-filler-plates-to-make-up-for-chinese-precision"
  },
  {
    "url": "/en/2021-01-14_abandoning-my-own-tablet-os/i_05_You-know-you-re-digital-pen-is-lacking-trust-if-you-grab-for-old-fashioned-pencil-and-paper_400x400px.jpg",
    "title": "You know you're digital pen is lacking trust if you grab for old fashioned pencil and paper...",
    "target": "/en/2021-01-14_abandoning-my-own-tablet-os/#you-know-you-re-digital-pen-is-lacking-trust-if-you-grab-for-old-fashioned-pencil-and-paper"
  },
  ...
]
To prevent the thing from being just a random link generator I deliberately put a little popup in it when you tap or click any visual. I utilise the image captions that my lemmid content manager maintains to reveal a bit of info enabling you to determine if you think it is worth opening the story.

Releasing the source code (AGPL)
While I am very happy with how the Visual Journal works on my site, I strongly believe in sharing. Chances are you have an even better idea for some Solari flip-flapping. Therefore I release the entire thing as free/libre software under the GNU Affero General Public License (AGPL). That means you can use, modify and distribute it yourself. Find the source code, readme and sample files at https://source.willem.com/visual-journal/
Conclusion
Judging by how it captivates my kids' curiosity, I am very happy with the visual journal, which jokingly dubbed Willemstagram. But unlike Meta's Instagram, this only serves visual to tell my stories and its source is libre. You can check it out on the homepage or by hitting the button below. What destination will you choose?
WillemstagramThis was written by hand. In an age of AI-generated text, this is my simple way of showing the human thought and effort behind these words. For those who are curious, the original (English) manuscript is available for download.
Manuscript (PDF)
Download
If you enjoy reading offline, this article is available for download:
Translations
This article is available in the following languages:
RSS / Atom
Grab one of the feeds to stay up to date, the feeds contain the full posts:
Manuscript
This was written by hand. In an age of AI-generated text, this is my simple way of showing the human thought and effort behind these words. For those who are curious, the original (English) manuscript is available for download.
