Writing · 4 Nov 2026
Laggy Legs
Three marathons through the eyes of running dynamics
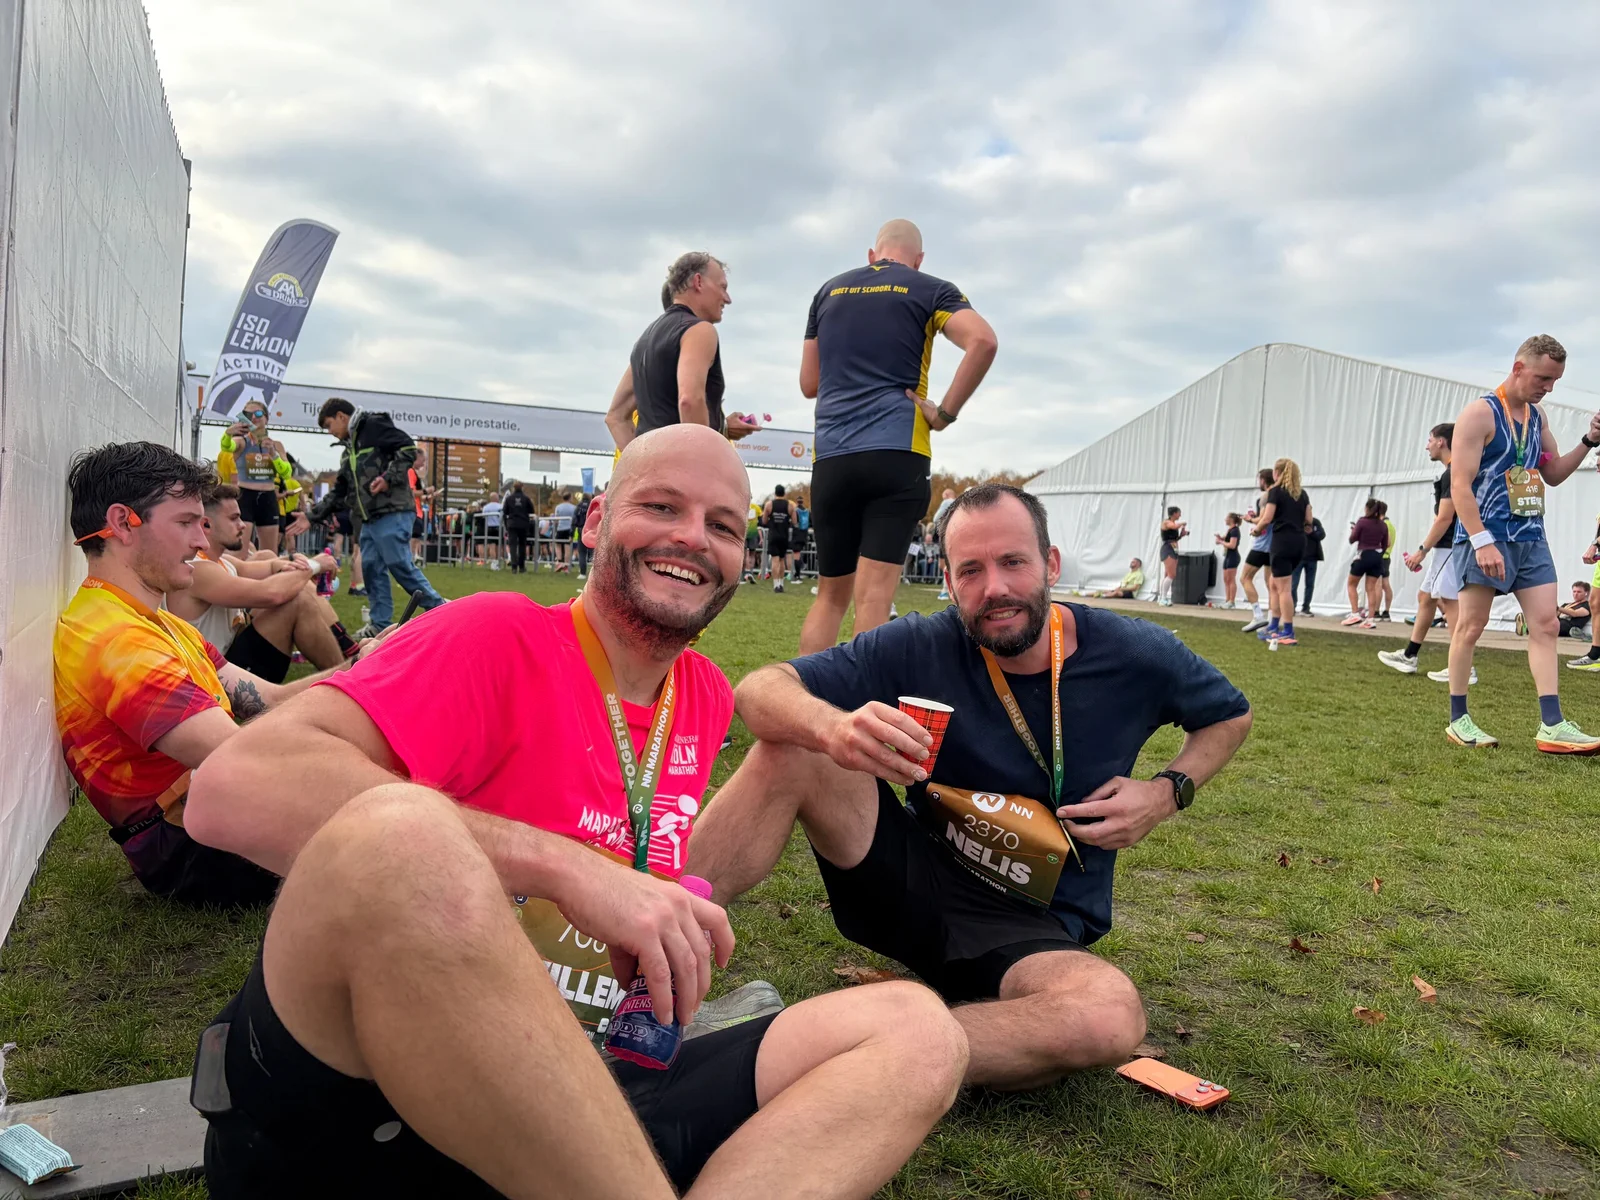
My Apple Watch records more than pace and heart rate. While I run, it also measures running dynamics: how long each foot stays on the ground, how long my stride is, how much I bounce, and an estimate of my power. I never looked at those numbers. This week I set up a new centralised store of all my Health data, enabling me to put three marathons side by side: Valencia 2024, Eindhoven 2025 and The Hague last Sunday. A post for the nerdy among us.
Three endings
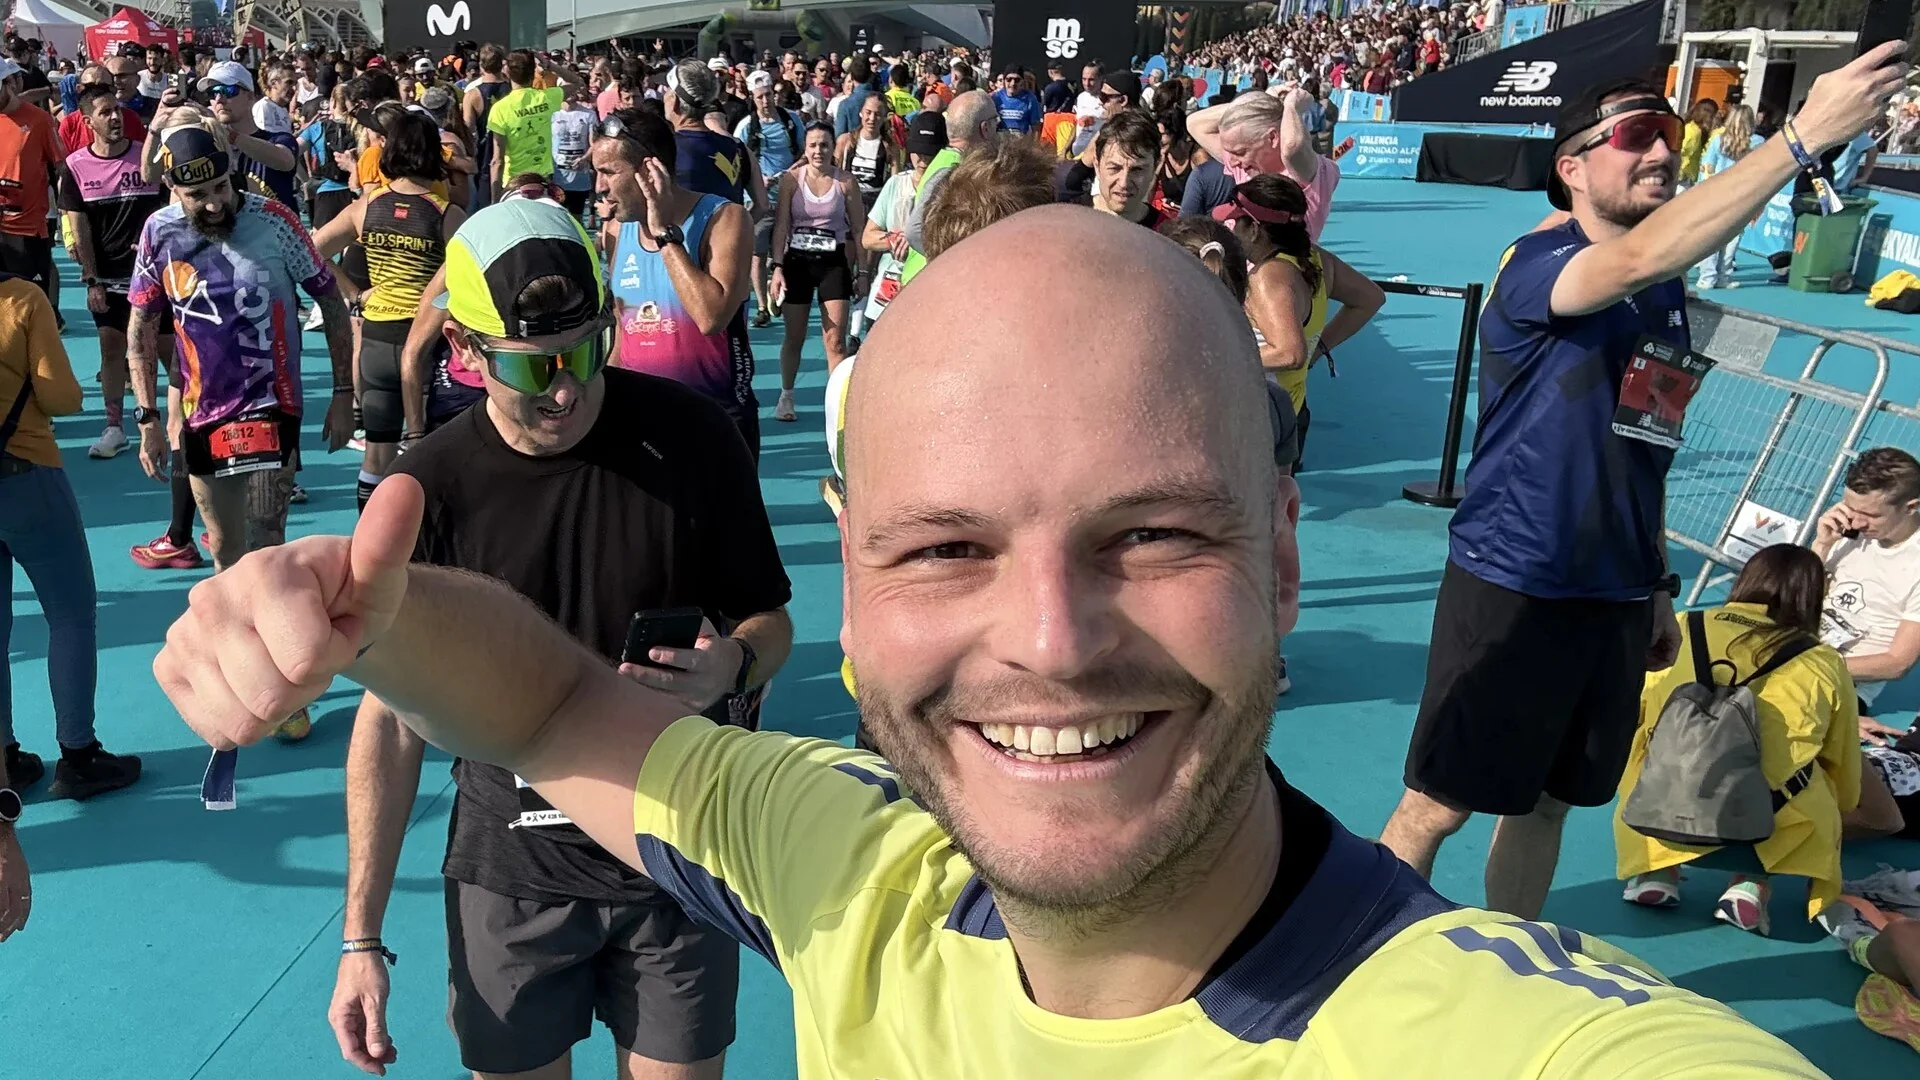
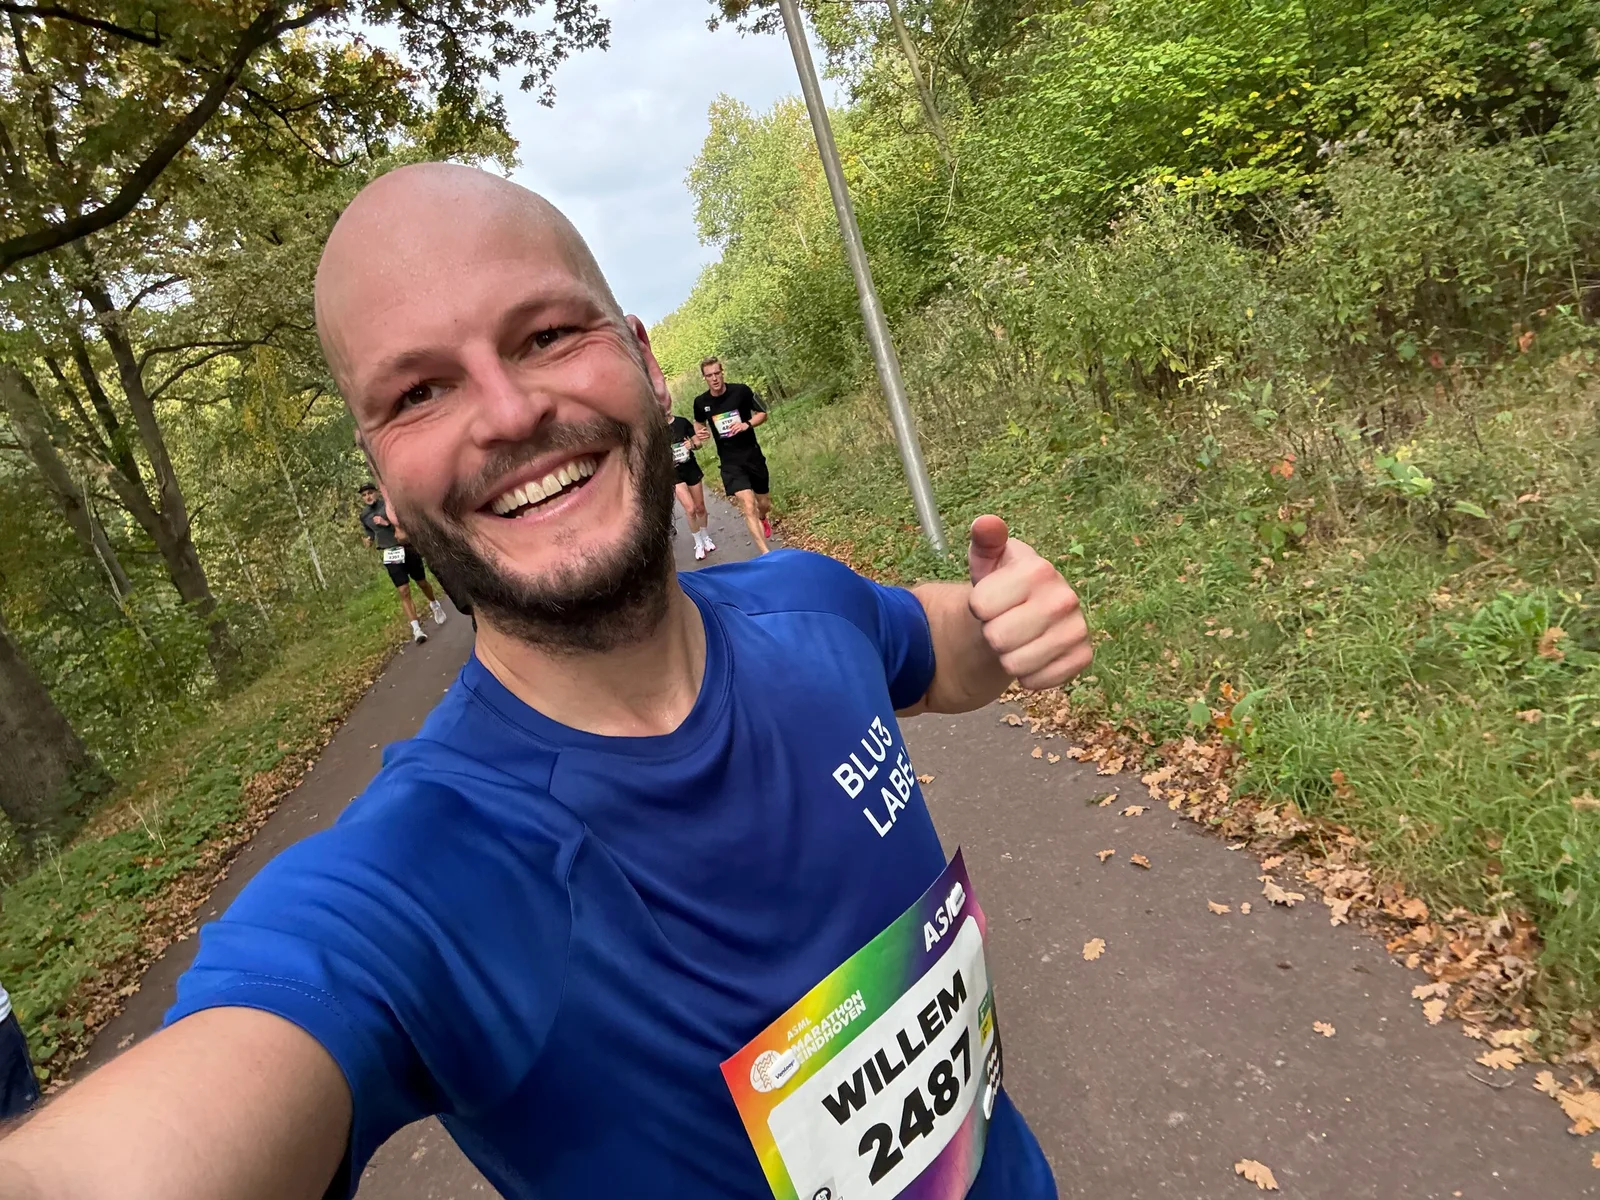
Each race ended differently. In Valencia I ran at about 5:50 per kilometre, the race I wrote about in Data versus Feeling. My legs stayed fresh: after kilometre 30 my ground contact time got shorter, my cadence went up and I ran the last two kilometres at 5:31. The cost showed up in my heart instead: in the sun it climbed from 154 to 168 beats per minute at the same pace. Eindhoven, my personal best, was the model race: power dropped only 3.5 percent and my foot left the ground quicker and quicker until the finish. The Hague was different. From kilometre 25 my ground contact time climbed back up by 13 milliseconds, my stride shrank from 1.18 to 1.12 metres and my power dropped 8 percent, while my cadence hardly moved, around 165 steps per minute. My head kept the beat, my legs delivered less with every step. That is exactly what I felt around kilometre 30: the stamina was there, but the response felt laggy.
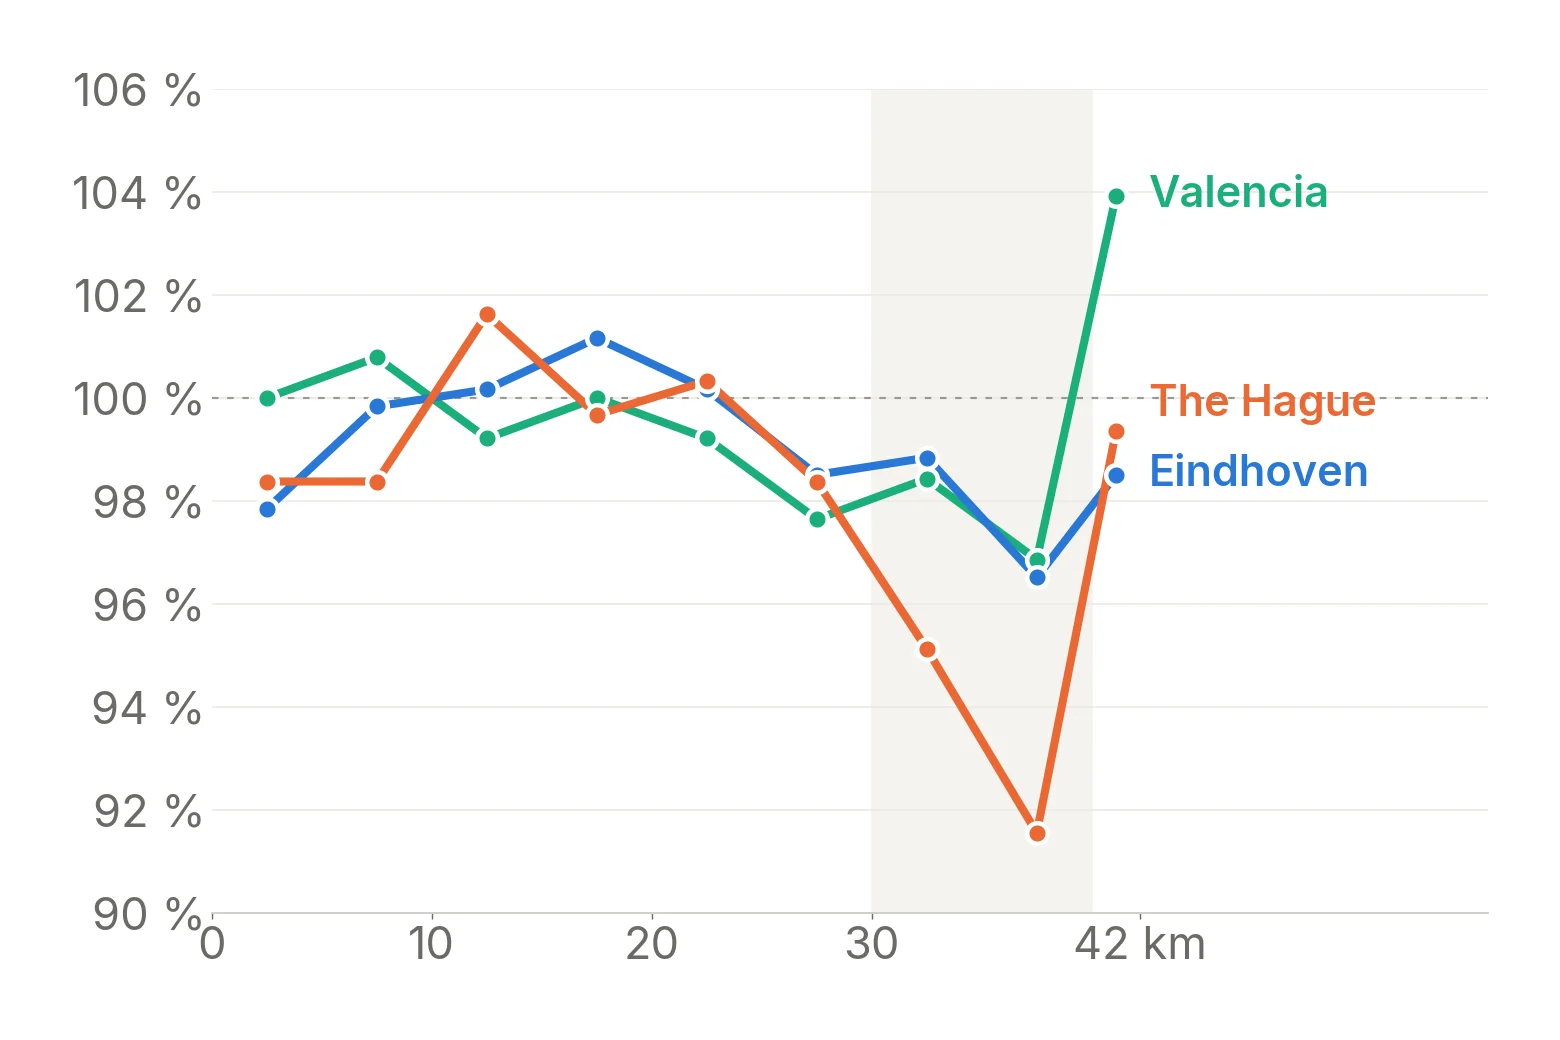
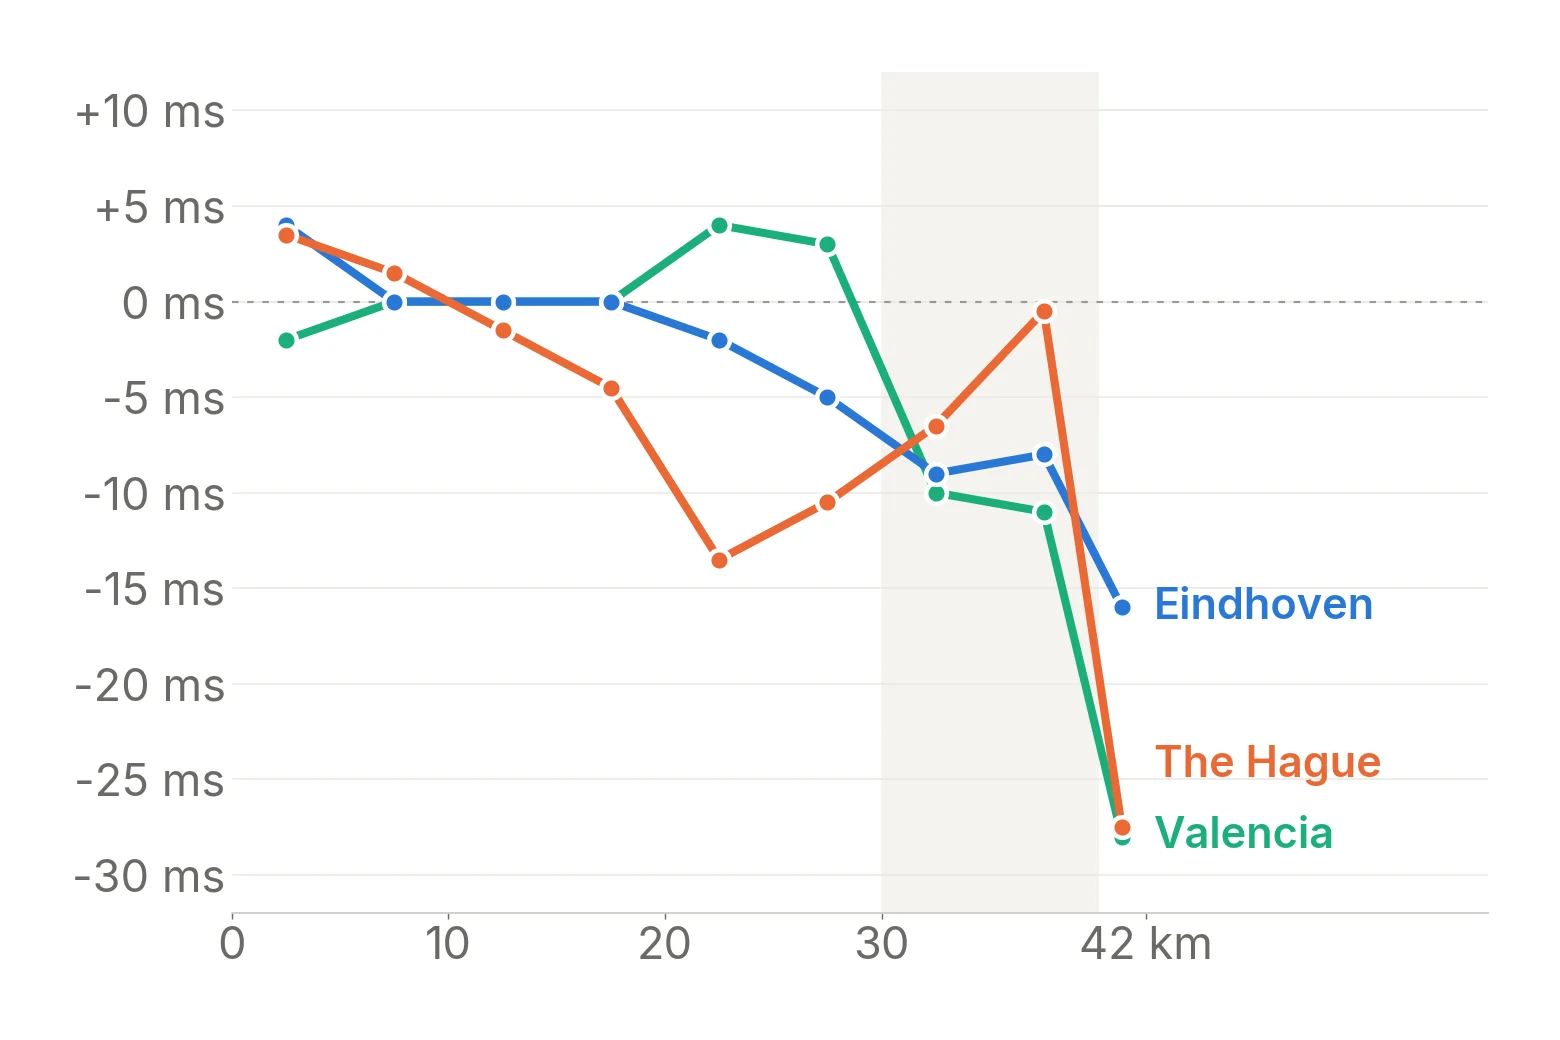
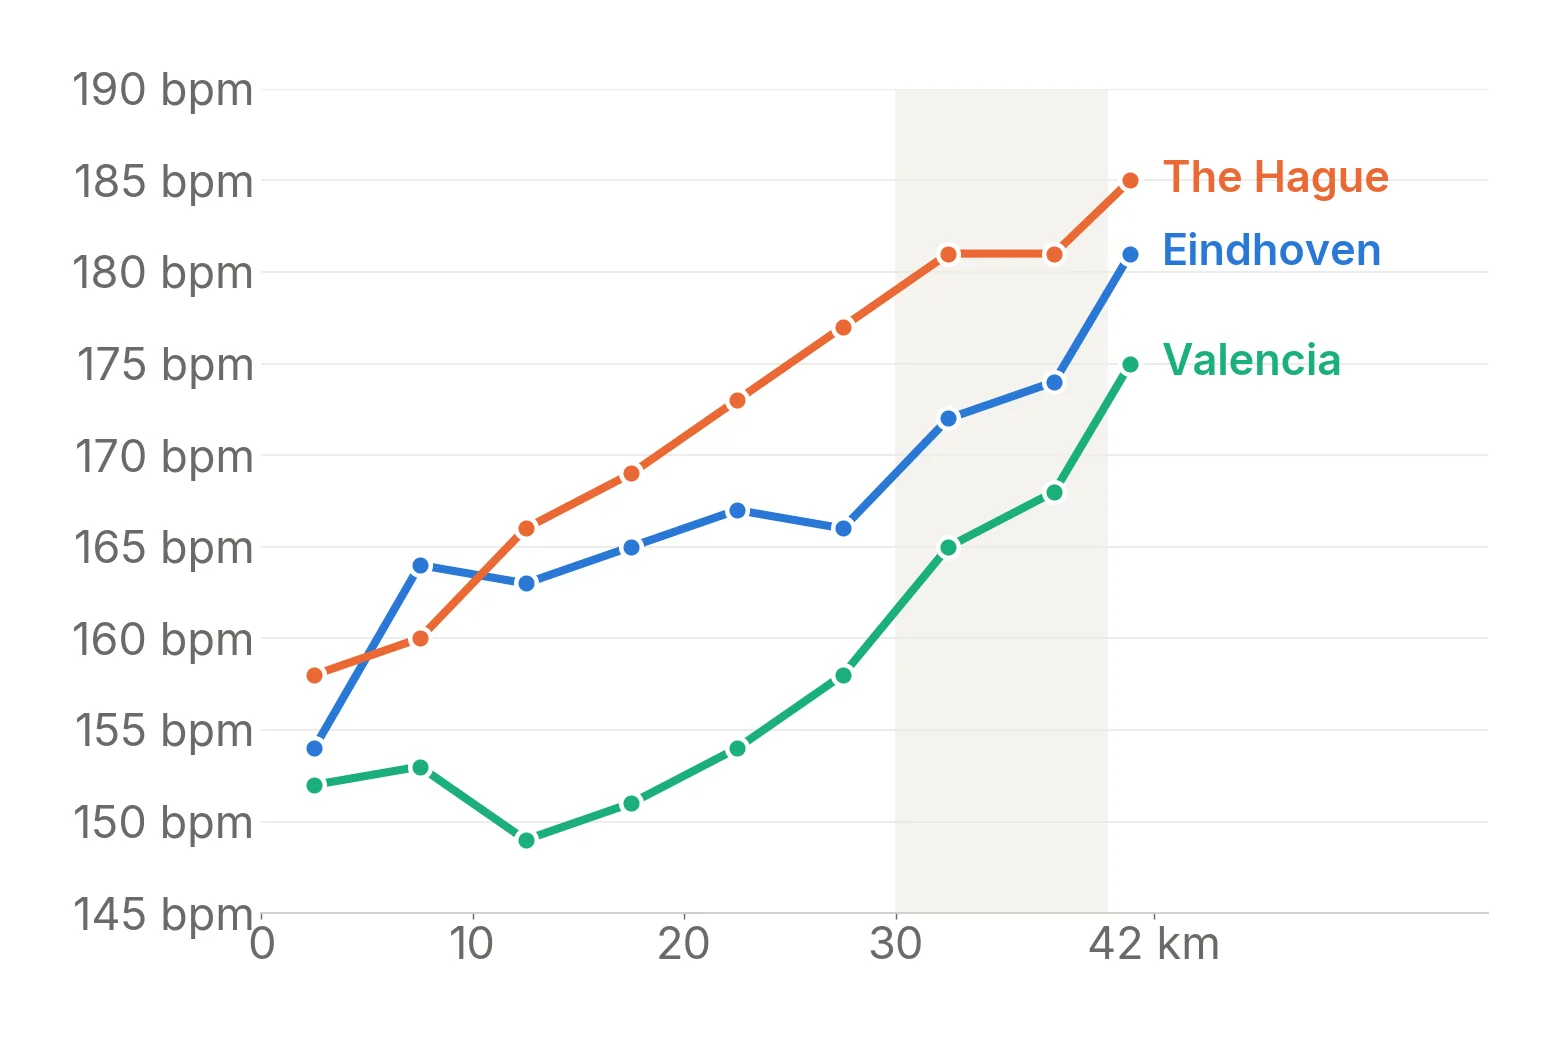
Side by side, the early, middle and late part of each race (kilometre 5 to 15, 20 to 30 and 35 to 40). Speed is stride length times cadence: in Valencia my stride got shorter too, but I stepped quicker. In The Hague I didn't.
| Valencia | Eindhoven | The Hague | |
|---|---|---|---|
| Pace (/km) | 5:53 → 5:58 → 5:59 | 5:08 → 5:09 → 5:16 | 5:08 → 5:08 → 5:32 |
| Heart rate (bpm) | 151 → 156 → 168 | 163 → 167 → 174 | 163 → 175 → 181 |
| Power (W) | 255 → 251 → 247 | 301 → 300 → 291 | 308 → 306 → 282 |
| Ground contact (ms) | 273 → 276 → 262 | 244 → 241 → 236 | 249 → 237 → 249 |
| Stride (m) | 1.03 → 1.00 → 0.98 | 1.18 → 1.18 → 1.15 | 1.21 → 1.19 → 1.12 |
| Cadence (steps/min) | 165 → 166 → 169 | 168 → 167 → 167 | 165 → 167 → 164 |
| Vertical oscillation (cm) | 9.8 → 10.2 → 10.1 | 10.0 → 10.1 → 10.3 | 10.6 → 10.6 → 10.7 |
Why
The dunes near Kijkduin and Scheveningen explain part of it: between kilometre 29 and 40 the course climbs and drops about 60 metres. But kilometre 39 went downhill and was still one of my slowest. The bigger difference is in the weeks before. For Eindhoven I ran long runs of 22 to 30 kilometres and went to the gym 11 times in 12 weeks. Before The Hague, the gym stayed at 3. Heart rate tells you how hard the engine works. Running dynamics tell you whether the legs can still deliver.
Conclusion
Three marathons, three limits: the heart in Valencia, nothing in particular in Eindhoven, the legs in The Hague. Next year I want to break 3:30, and that means Valencia's fresh legs at more than Eindhoven's speed. The plan writes itself: long runs and strength work, so the legs stay springy past kilometre 40. And on long training runs I now have a new number to watch: my ground contact time in the last hour.